Table of Contents
VisiData
VisiData is an interactive CLI table explorer with vim key bindings. Here is a really great tutorial. These are notes to myself.
Source Table Recommendations
Gather data with more granularity than you think you need. You often need three tables:
- Logs: Include date, build (includes platform ID), product ID, params of log, total count, unique devices.
- Device Activity: Includes date, build, product ID, active time, active device count.
- Mappings from product ID to product name: (Maybe from platform ID or from product ID.)
Open VisiData and Set Data Types
$ vd logs.csv active_devices.csv id_name.csv
Set Column Types, Widths, Names, Importance
| Key | Meaning |
|---|---|
| _ | Adjust widths of columns |
| @ | Column type is date. |
| ! | Column is important. (Will be key for table merging.) |
| # | Column is integer. (Set aggregator to sum.) |
| + | Set aggregator, usually to “sum” |
| ; | Extract regex to new column. Ex, (video|audio), (^..) or (^([STUVW]...|..)) |
| ^ | rename the column. Might have to be “product_id” or “platform_id” |
| = | Use Python function to create new column. Ex, hex to dec: int(curcol,16) |
| : | Split column by regex |
| - | Hide column |
| S | Go to “Sheets” sheet, to select another sheet to format. |
| q | Leave the sheet. (gq quit all sheets) |
| F | Make a Frequency Table for the selected column. (gF for selected columns) |
| U | Undo. R Redo. |
| d | Delete row. (I only use this on Sheets sheet.) |
| , | Select all rows that match this column's value |
| “ | Open duplicate sheet with only selected rows |
Inspecting Columnar Data
| Key | Meaning |
|---|---|
| I | Describe all columns, errors, distinct, mode, mean, median, stdev, etc. |
| i | Add a column of incrementing numbers (useful for '.' charts) |
| . | Requires an “important” numeric column for row data. Make chart. |
| O | Options to enable “numeric_binning” and set number of “histogram_bins” (use 'e') |
| F | Frequency table of row counts, or histogram if numeric_binning is true |
Case Study Link: Exported CSV from PG&E
Cast Study: Merging Two Tables, logs and metadata
Protip: Use column view to set multiple columns at once
| Key | Meaning |
|---|---|
| C | Go to column view, each row is data for a column. |
| t | Select rows, select all integer rows. |
| ge | Go to “type” column, enter ge (global edit), type “int” |
Go to “aggregators”, enter ge, type “sum” |
|
| q | Leave that table. |
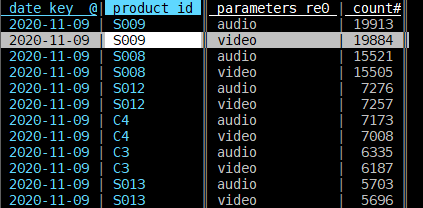
For example, your “logs.csv” would end up looking like:
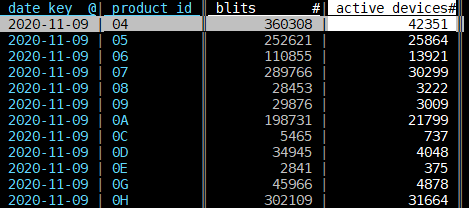
Your active_devices.csv would look like this:
Join Sheets
Use ! to set Key columns. Use F (or gF) to remove dupes of Keys by making a Frequency Table.
| Key | Meaning |
|---|---|
The key columns to join have to match names. Check and rename with ^. |
|
| S | Go to Sheets sheet |
| t | (toggle) Select the sheets you want to join by key columns. |
| & | (or g&) Join sheets. Type “inner” for an inner join. |
| gu | Next time you're in Sheets, “global unselect” to unselect the sheets you selected. |
Protip: Remove insignificant noisy rows
| Key | Meaning |
|---|---|
| z| | Select rows matching Python expression. Type “blits > 10000” |
| ” | Make a new sheet with selected rows |
And the merge of the logs and active devices sheets would look like:
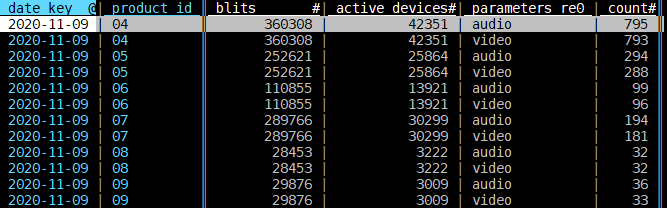
Do a similar thing to join the Joined Sheet with the product Name sheet.
Process Data
In your final Joined sheet, add rows that are calculations of other rows.
| Key | Meaning |
|---|---|
| HL | (JK for rows) Move columns |
| - | Remove columns |
Maybe use C to assure desired columns are ints and aggregators are “sum” |
|
| ! | Toggle key columns. |
| gF | global Frequency Table so key columns are unique. |
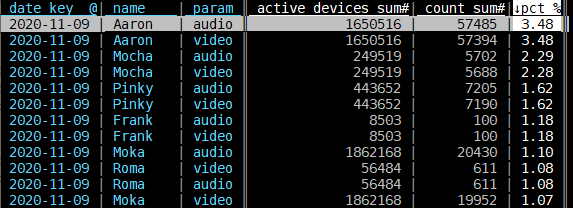
| = | Add column. Enter count_sum * 100 / active_devices_sum |
| % | Set new column as float. |
| _ | Resize columns |
| ] | Sort by column |
| . | (g. for multiple columns) Make a graph based on Key column. |
Now you should have some basic info to keep exploring. When you want to save what you've done:
| Key | Meaning |
|---|---|
| Ctrl+s | Save sheet |
| Ctrl+d | Save command log (cmdlog). Use extension “.vd”. You can replay what you've done later! |
The commandlog is a CSV file too. The first lines are the open file commands. So to replay, you only have to specify the command log like so:
$ vd --play=my_cmdlog.vd --replay-wait=0.5